SEOUL CITY RHYTHM: THE DATA
POPULATION
The official census population serves as the starting point for creating a plan to prepare for the future needs of a city. It is the premise on which transportation demand estimation and decisions regarding land allocation for various land uses and housing supply are based. But if there is a significant gap between de facto population* and census population, the foundation of city planning needs to be reexamined.
•The de facto population is a concept under which individuals (or vital events) are recorded (or are attributed) to the geographical area where they were present (or occurred) at a specified time.
Source: OECD Glossary of Statistical Terms, https://stats.oecd.org/glossary/detail.asp?ID=571
At 3 AM, most people are asleep. Unlike people who are temporarily in Seoul during daytime for specific purpose(s), the de facto population measured at this time of the day creates housing demand that needs to be somehow met. In this context, we examined the difference between the de facto population and the census population for the following three groups: “the young in their 20s,” “the seniors in their 60s and above,” and “long-term stay foreign residents.”
The de facto population is always larger than the census population, by about 200,000 (13.6%) for the 20s group, by about 430,000 (22.2%) for the 60+ group, and by about 200,000 (72.6%) for the foreigner group. Both the difference and ratio are greatest for the 60+ group. This difference can be easily explained for the 20s group, as many are college students studying in Seoul whose registered addresses are still with their parents. However, finding the underlying reasons that can explain the difference in the 60+ group is more elusive.
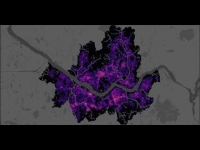
The map below shows areas with the largest population difference in the 60+ group. For some areas, the key contributing factors reveal themselves. First, there are many seniors in large hospitals and nursing homes, for example in Doksan-dong and Severance Hospital areas. Second, many people work late night into early morning hours in Dongdaemun and Garak markets. In large apartment complexes in Godeok-dong and Mok-dong, many seniors may be living with their adult children in Seoul without changing their addresses back home. It is more difficult to explain the difference in Yeouido’s business district.
Barring such areas with very specific reasons, the difference between the de facto population and the census population has the potential to become an indicator that reflects housing vulnerability. The de facto population data has the potential to replace the census data and become the basis for city planning process in the future, after its accuracy had been verified. With this newly available data, we hope that a more effective housing policy will be introduced – one that is customized specifically for each group: the 20s, the 60+, and the foreign residents.
Barring such areas with very specific reasons, the difference between the de facto population and the census population has the potential to become an indicator that reflects housing vulnerability. The de facto population data has the potential to replace the census data and become the basis for city planning process in the future, after its accuracy had been verified. With this newly available data, we hope that a more effective housing policy will be introduced – one that is customized specifically for each group: the 20s, the 60+, and the foreign residents.
For valid comparison, the de facto population and the census population data both from early 2017 were used. In the same year, the Seoul Metropolitan Government announced that Seoul’s de facto population is larger than the census population on average by about 1.38 million people. Our analysis shows that the three groups (the 20s, the 60+, and the foreign residents) account for approximately 60% of this difference.)
MOVEMENT
The hourly change in the de facto population indicates movement. The data tracts where the de facto population decreased show movement away from that tract (“origin”), and the data tracts with increased de facto population show movement to that tract from other tracts (“destination”). By adding the total amount of decrease and the total amount of increase, it is possible to distinguish the amount of movement within Seoul and the amount of movement between Seoul and outside.
The graph above shows the ratio of movement across Seoul’s boundary for the three groups – the 20s, the 60+, and the foreign residents. The group with the highest ratio is the 20s, reaching inbound peak (+3%) between 7-8 AM on weekdays, and outbound peak (-1.5%) after 10 PM. It is an indication that many in their 20s are spending long hours commuting every day. The pattern of movement of the 60+ group is not much different, but the ratio is lower than the 20s group. The inbound peak is also reached about two hours compared to the 20s group.
The foreign residents group shows a completely different pattern. There were more outbound movements in the morning and corresponding inbound movements in the evening rush hour. In other words, many foreign residents live in Seoul but work outside Seoul.
Both the 20s group and the 60+ group head into Seoul during the weekends, reaching inbound peak around noon. Outbound peaks vary for each group. An interesting fact is that the foreign residents group’s inbound peak is around 8 PM on Saturdays. It can be surmised that these movements represent either the wholesale merchants visiting markets in Seoul, or the people heading to Hongdae, Itaewon, and other neighborhoods for entertainment.
The graph below shows changes in movement within Seoul. Except during morning commute hours, there is little difference in the ratio between the 20s group and the 60+ group. In fact, the graph shows the 60+ group being more active during the weekends – a testament to the vitality of the 60+ group. It is also remarkable that during the working hours on weekdays, the ratio of movement of the 20s group falls to a level similar to one seen when they are asleep late at night.
An unexpected result is that both the 20s and the 60+ group show the highest rate of movement (approximately 14%) between 10-11 PM. While more research is needed to learn about the causes behind this phenomenon, it reflects the fact that the people of Seoul do not go to bed until late at night. Some common reasons are working late, picking up children from private institutes (hakwon), and simply going for a walk in the neighborhood.
The foreign residents group show the lowest rate of movement within Seoul even during the peak hours, at about 6%. Given the pattern of movement leaving Seoul in the previous analysis, it shows that unless heading to workplaces scattered across the metropolitan area outside Seoul, many foreign residents stay in their neighborhood most of the day. It reflects a strong economic ecosystem in their neighborhoods. In line with the pattern of movement between Seoul and outside, the pattern of movement within Seoul of the foreign residents group also reaches its peak on Saturday nights (approximately 10%).
(The difference between the sums of de facto population increases and decreases at a specific point in time reflect movements in and out of the city. When the total amount of in- and out- movements is negative, the value is defined as ‘outflow.’ When positive, it is ‘inflow.’ It is assumed that with outflow, the increase in the de facto population (and vice versa, with inflow, the decrease in the de facto population) indicates the total amount of internal movements.)
POPULATION MIX
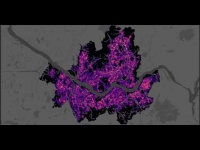
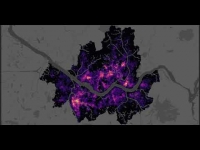
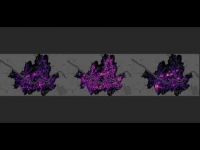
Where in Seoul can we find the three groups (the 20s, the 60+, and the foreign residents) living close to each other? From what we have learned above, we can reasonably deduce that the areas with high foreign resident ratio would also have higher of population mix – given relatively lower mobility of the foreign residents. Such areas include Chinese immigrant neighborhoods around Daelim and Konkuk University stations, Sinchon and Kyung Hee University neighborhoods with large foreign student population, and Central Asian immigrant neighborhood in Dongdaemun area. However, a more significant difference can be found when the hourly change in the mix is examined.
The maps above show population mix at two different times of a day. Darker red indicates a higher level of mix, while darker green represents simpler population composition. At 3 AM when most people are asleep, a substantial area is colored in dark red, centered around neighborhoods with high foreign resident population. But at 3 PM when people are working, the level of mix drops remarkably. It indicates that these different groups live together, but not work together. In particular, Gangnam and Seocho areas show relatively homogenous population composition, despite being the center of economic activities. It shows that the foreign residents have yet to enter the workforce mainstream.
(The population mix for each group was measured using an entropy index. The index is highest when the population proportions of the three groups (the 20s, the 60+, and the foreign residents) are the same. For valid comparison, cells with less than 50 de facto population have been eliminated.)
서울도시리듬 : 데이터
인구
주민등록인구는 미래를 대비하는 도시계획 수립의 출발점이다. 주민등록인구를 근거로 용도별 토지면적을 배분하고, 교통수요를 추정하며, 주택 공급량을 결정한다. 하지만 실제 생활인구와 주민등록인구 사이에 큰 차이가 있다면 도시계획의 근거가 흔들린다 할 수 있다.
새벽 3시는 대부분의 사람들이 잠들어 있는 시간이다. 이 시간대의 생활인구는 일과를 목적으로 서울을 잠시 방문했다 떠나는 인구와 달리 어떠한 형식이든 주거 수요를 창출한다. 이러한 관점에서 20대 청년과 60대 이상 노인 그리고 90일 이상 장기체류 외국인을 대상으로 생활인구와 주민등록인구의 차이를 들여다봤다.
주민등록인구 대비 생활인구는 20대가 약 20만명(13.6%), 60대 이상 약 43만명(22.2%), 외국인이 약 20만명(72.6%) 더 많으며, 총량과 비율 모두 60대 이상에서 가장 차이가 크다. 20대에서 이러한 차이는 주소지를 지방의 부모님 집에 남겨둔 채 서울에서 유학하고 있는 대학생들이 대부분을 설명한다. 하지만 60대 이상에서의 이러한 차이는 설명하기 쉽지 않다.
아래 지도는 60대 이상을 대상으로 생활인구와 등록인구의 차이가 가장 큰 지역들을 보여주고 있다. 이로부터 크게 두가지 이유를 분별할 수 있다. 첫번째는 대형 병원과 요양원(독산동 일대)에 입원해 있는 분들이다. 두번째는 동대문과 가락시장에서 새벽 시간에도 경제활동을 하고 있는 분들이다. 그 밖에 고덕동과 목동 아파트단지 일대에서는 지방에 주소지를 남겨두고 서울의 자녀와 함께 체류하고 계신 노인들일 수 있다. 여의도 업무지역의 차이는 설명하기가 쉽지 않다.
이유를 막론하고 주민등록인구와 생활인구의 차이는 주거취약계층의 실태를 반영하는 지표가 될 수 있다. 앞으로 생활인구 데이터가 보다 체계적인 검증 절차를 거친다면 생활인구는 주민등록인구를 대신하여 도시계획 집행의 새로운 근거가 될 수 있을 것이다. 이를 기반으로 청년과 노인과 외국인을 위해 보다 실효성 있는 주거정책이 수립될 수 있기를 기대해 본다.
(집계구별 센서스 자료와 생활인구의 적법한 비교를 위하여 2017년 상반기 통계자료를 근거로 작성되었다. 같은 해 기준 서울시 발표에 따르면 서울시 전체 생활인구는 주민등록인구보다 평균 138만명 더 많다. 20대와 60대 이상 노인, 그리고 외국인이 초과 생활인구의 60%를 설명하고 있는 셈이다.)
이동
시간대별 생활인구의 변화는 어떠한 이유에서는 이동이 발생했음을 의미한다. 생활인구가 감소한 집계구는 그 곳으로부터 다른 곳들로 이동이 발생한 것이며(기점), 생활인구가 증가한 집계구는 다른 곳 들로부터 그 곳으로 이동이 발생한 것이다(종점). 감소 총량과 증가 총량을 합산하면 서울과 서울 외부 사이의 이동량과 서울 내부의 이동량을 구분하는 것이 가능하다.
위의 그래프는 청년, 노인, 외국인을 대상으로 서울 외부이동의 비율을 보여주고 있다. 서울 외부 이동의 비율이 가장 높은 계층은 20대로, 평일 오전 7시~8시 사이에 유입 첨두(+3%)를, 오후 10시 이후에 유출 첨두(-1.5%)를 형성한다. 이로부터 20대가 일상이 얼마나 피곤할 지를 가늠해볼 수 있다. 노인들의 외부이동 패턴 자체는 20대와 크게 다르지 않으나 비율이 20대만큼 높지 않고, 유입시점 역시 20대보다 약 2시간 가량 늦음을 확인할 수 있다.
외국인은 이러한 패턴과 정반대이다. 그들은 오전 출근 시간에 서울 외부로 유출되고, 저녁 퇴근 시간에 서울로 유입되는 패턴을 보이고 있다. 즉 생활은 서울에서 일은 수도권에서 영위하고 있는 셈인 것이다.
청년과 노인 모두 휴일에도 서울을 찾고 있는데, 평일보다 늦은 오후 12시경 유입 첨두를 형성하며, 유출패턴은 연령별로 상이하다. 특이한 점은 외국인이 서울로 유입되는 비율이 가장 높은 시간대가 토요일 오후 8시경인데, 아마도 지방의 도매업자들의 서울 방문 또는 유흥을 목적으로 한 이동이 아닐까 추측해 본다.
아래 그래프는 서울 내부의 이동을 보여주고 있다. 오전 출근시간을 제외하면 청년과 노인의 이동 비율에는 큰 차이가 없는데, 휴일에는 오히려 노인이 청년보다 더 많이 이동하는 경향을 확인할 수 있다. 이는 그만큼 왕성한 노인의 활동력을 방증하는 결과일 것이다. 평일 일과 시간 중 20대 청년의 이동률은 거의 잠자는 시간대와 유사한 수준까지 떨어짐 또한 주목할 만한다
청년과 노인 모두 22-23시에 가장 높은 이동율(약 14%)을 보이는데, 이는 예상하지 못한 결과이다. 그 원인은 더 자세한 연구가 필요하겠지만, 그만큼 일찍 잠들지 못하는 서울 시민들의 일상을 반영하고 있다고 볼 수 있다. 늦은 귀가, 학원생 픽업, 동네 산책 등 다양한 일상의 양태들이 관련 있을 것이다.
외국인의 경우 내부 이동률이 첨두시에도 약 6%로 세 집단 중 가장 낮다. 즉, 앞서 살펴본 외국인의 외부 이동비율과 함께 생각해보면 이들은 수도권에 흩어져 있는 직장으로 출퇴근하는 것이 아니라면 대부분 시간 그들의 생활권을 벗어나지 않는 다는 것을 보여주고 있다. 그만큼 자체적인 경제 생태계가 특정 지역을 중심으로 형성되어 있는 것이다. 외국인의 내부이동 역시 외부이동과 마찬가지로 토요일 밤에 10%까지 증가하는 경향 역시 확인된다.
(특정 시간대 생활인구 총 감소량과 총 증가량의 차이는 외부 이동량을 반영한다. 외부 이동량이 음수일 때를 유출, 양수일때를 유입으로 구분했다. 외부 이동이 유출인 경우에는 생활인구의 총 증가량이, 유입인 경우에는 생활인구의 총 감소량이 내부 이동량을 반영하는 것으로 보았다.)
인구혼합
청년과 노인과 외국인이 함께 혼합되어 공존하는 비율이 높은 지역은 어디일까? 앞서 살펴본 것과 같이 외국인들의 이동성은 상대적으로 낮기 때문에 외국인 밀집 지역에서 혼합도가 높을 것이라고 쉽게 유추해 볼 수 있다. 중국인 밀집 지역인 대림역과 건대입구 일대, 그리고 유학생들이 집중 거주하고 있는 신촌과 경희대 주변 지역, 중앙아시아인들의 생활권인 동대문 일대가 그러한 지역이다. 하지만 중요한 차이는 혼합도의 시간대별 변화에서 찾아볼 수 있다.
인구 집단별 혼합도는 엔트로피 entropy 지표를 활용하여 측정하였다. 청년과 노인과 외국인이 같은 비율로 존재할 때 최대값을 갖는다. 유의미한 비교를 위해 총 생활인구 50명 미만의 셀은 일괄적으로 제거했다
Credits:
Producer and writer: Park Seoeun
Director: Kim Siyeon
Graphics: Kim Siyeon, Park Jiyoon, Woo Hyeunjoo
Composer: Kim Siyeon
Editor: Kim Siyeon
Voice: Ariane Carmignac
Sound design, mixing: Kim Siyeon
Data: Kim Wooil, Park Hoontae, Shin Joongho
Engineering help: Kim Hojoong, Shin Joongho, Jeong Sangchul, Lee Sanghoon
Production: ARTLab
Coordinator: Suh Heesun / K’occa
With the support of Korea Creative Content Agency
ⓒ 2019